

Summer '26 Update: Modern Web Console
Web Console in Summer ’26 introduces a tab-based Salesforce workspace that helps developers navigate efficiently and improve productivity
By Abishek Kumar
Asst. Software Developer
Summer '26 Update: Modern Web Console
Salesforce Summer ’26 brings one of the most exciting developer tools in years, Web Console, a modern browser-based IDE built directly into Salesforce.
Gone are the days of juggling the aging Developer Console for quick fixes or spinning up a full VS Code environment just to debug a log or run a SOQL query. Web Console lives inside Salesforce, loads instantly in your browser, and requires zero setup. At its core, Web Console is built around a simple idea. Developers should not have to leave Salesforce to build Salesforce apps. Whether you're an admin debugging a Flow, a developer handling a production issue, or a consultant making a quick Apex fix, Web Console puts a full IDE one click away, right where you already work.
The Problem It Solves
For over a decade, the Developer Console was the only in-browser tool Salesforce developers had. It worked, but it never evolved. There was no LWC support, the JavaScript stack was outdated, and the UI has not significantly changed since 2011. Serious developers moved to VS Code with the Salesforce CLI, but that requires a configured local machine. This is not practical for quick fixes or urgent production issues on the go. Additionally, tools like Workbench, which are commonly used for SOQL and metadata queries, are unofficial and unsupported. This creates a gap in Salesforce’s native tooling.
Web Console solves all these problems in one solution. It provides a modern in-browser IDE, LWC support, and a first-party alternative to Workbench, all secured within Salesforce.
How to Enable Web Console
Web Console ships off by default. It can be enabled by an admin in the Setup menu. The process takes under two minutes:
Step 01: Log In and Open Setup Navigate to your Salesforce org and click the ⚙️ gear icon in the top-right navigation to open Setup.
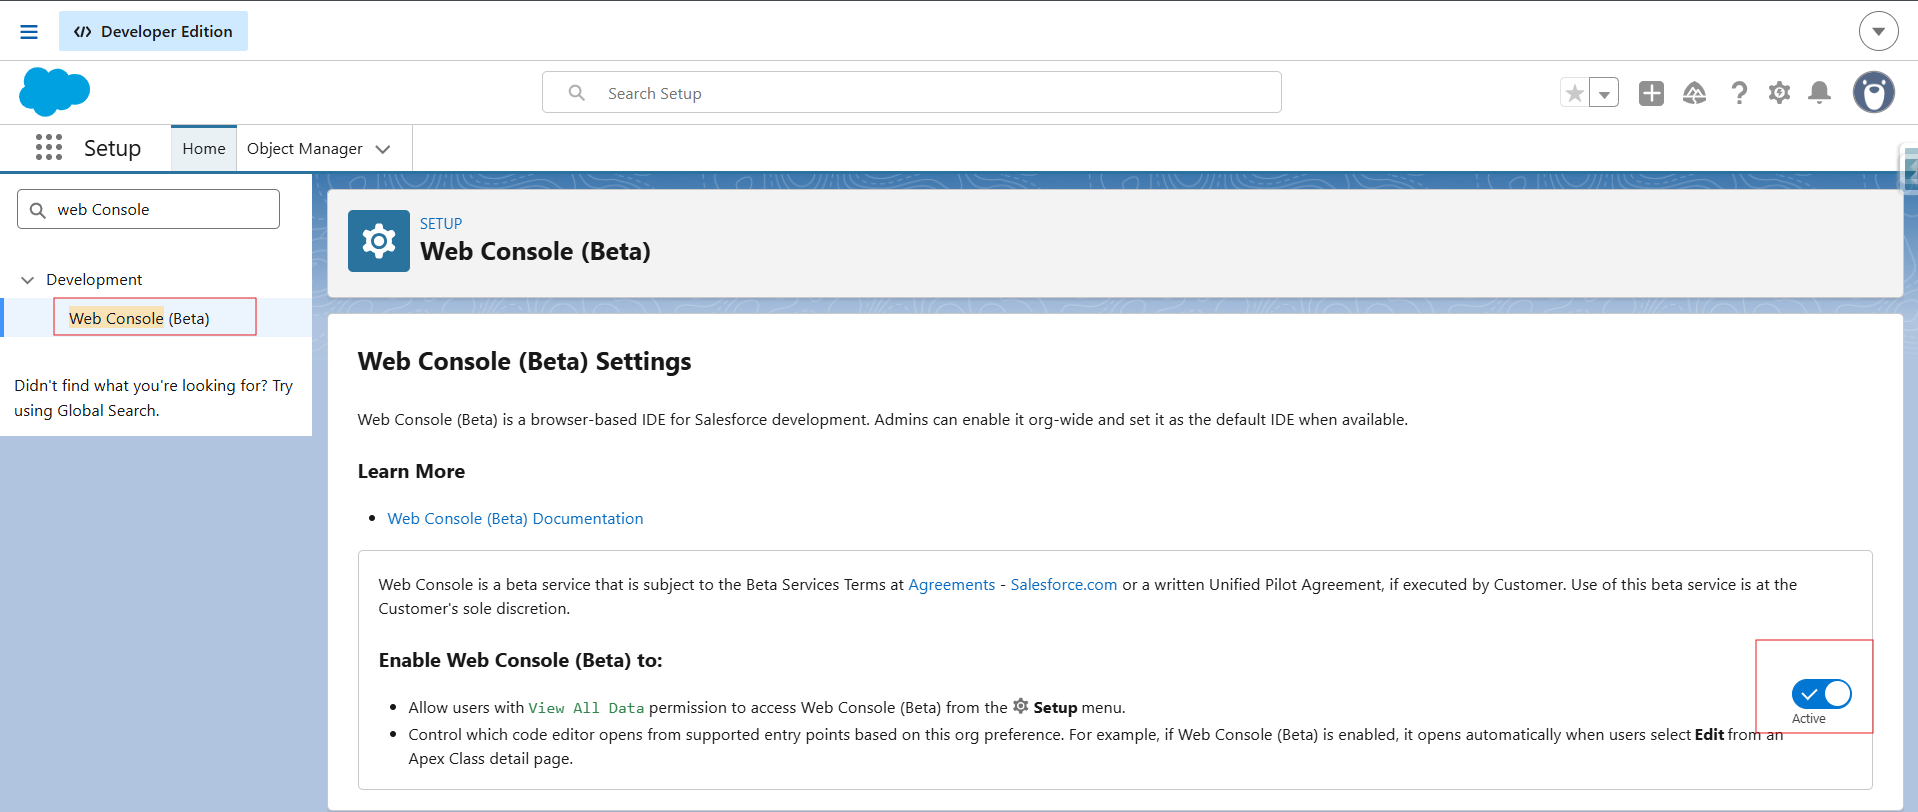
Step 02: Search "Web Console (Beta)" Type "Web Console" in the Quick Find search box on the left sidebar. Select the Web Console (Beta) page from the filtered results.
Step 03: Enable the Toggle Flip the enable toggle to ON. Orgs that choose not to participate in the beta can leave this off and continue using Developer Console as before.
Step 04: Refresh Your Browser After saving, refresh the page. The Web Console icon will now appear in the top-right navigation area of the Salesforce interface.
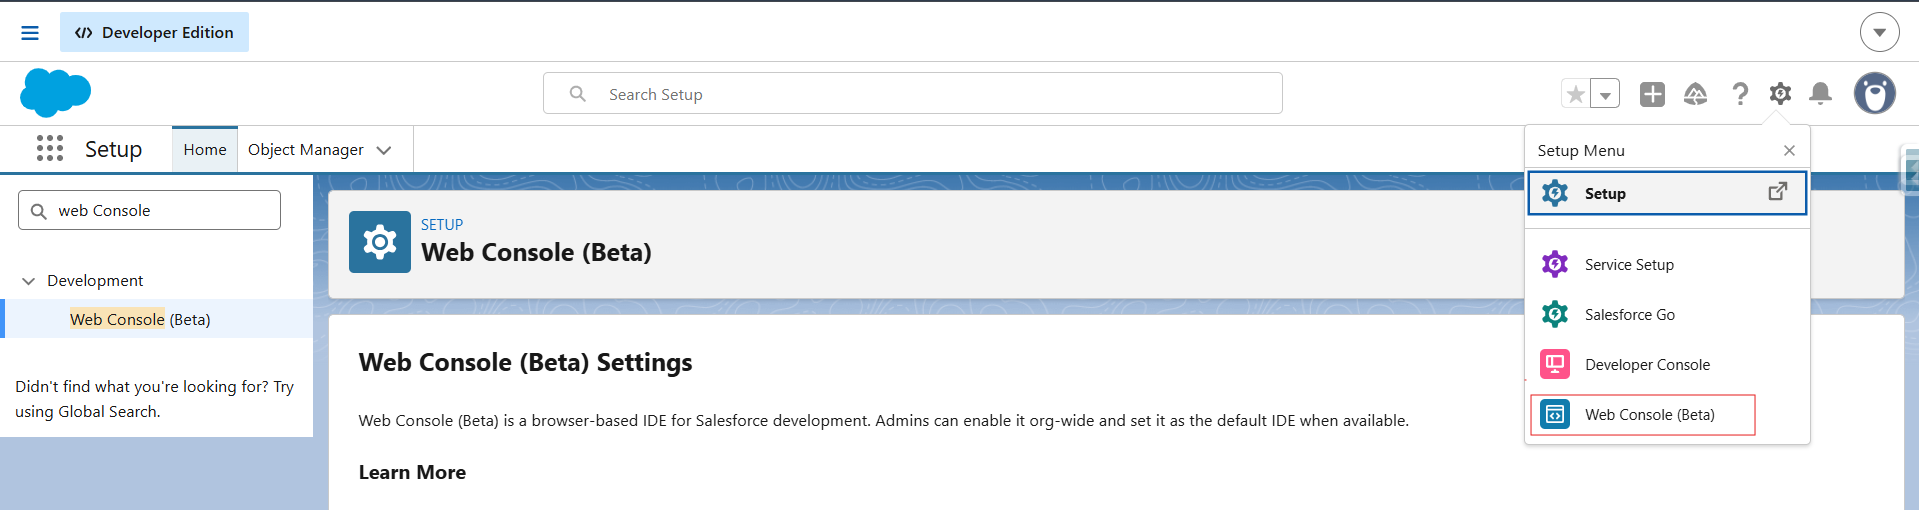
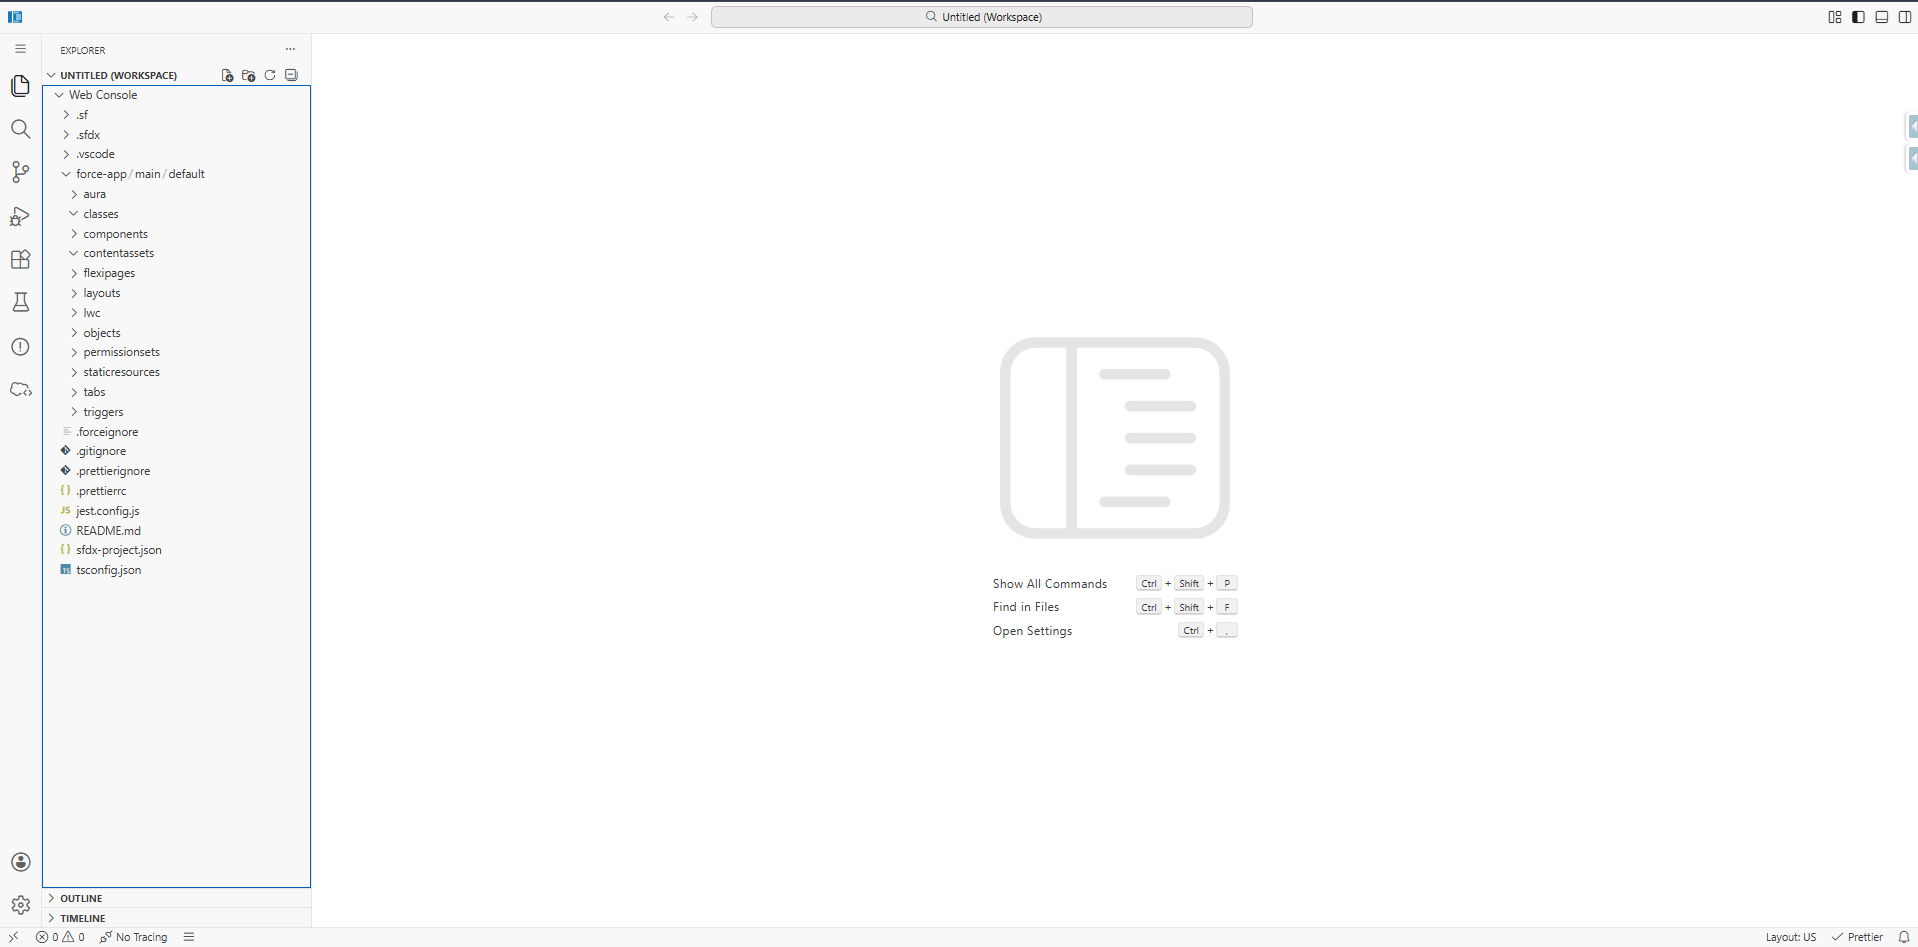
Step 05: Launch and Explore Click the icon to open Web Console. Use Ctrl-click (Cmd-click on Mac) to open it in a dedicated browser tab for a full-screen IDE experience.
Features of Web Console
The beta is intentionally focused on the workflows developers and admins use most when they need to investigate and fix something quickly. These include debug log viewing, SOQL execution, Query Plan inspection, Anonymous Apex execution, and quick, in-context Apex edits. Web Console is also designed to support metadata navigation through an org-aware browser experience, so developers can stay grounded in the org while they work.
Here is a breakdown of each core capability:
- 🪲 Debug Log Viewer View, filter, and analyze debug logs in context. Trace flags are configured via a traceLogs.json file inside the tool. No more copying logs to a text editor to search through them.
- 🔍 SOQL Execution Run SOQL queries against live org data with real-time inline results. This directly replaces the need for the unsupported Workbench tool for ad-hoc data queries.
- 📊 Query Plan Inspector Inspect query execution plans to identify performance bottlenecks and understand how Salesforce will process your queries before they hit governor limits in production.
- ⚡ Anonymous Apex Execution Execute ad-hoc Apex scripts for troubleshooting, data validation, or one-time fixes — no class creation or deployment required.
- ✏️ Inline Code Editing Make targeted edits to Apex classes, Visualforce pages, and — for the first time in any browser-based Salesforce tool — Lightning Web Components (LWC).
- 🧭 Org-Aware Navigation Web Console is designed to launch from Salesforce surfaces where developers are already working, such as directly from a failed Apex Job in Setup, opening with that code already in focus.
- 🆕LWC Support — Finally: This is the most significant capability gap Web Console closes. Developer Console never supported Lightning Web Components meaning in-browser LWC editing was impossible for over six years. Web Console fixes this from day one of the beta.
These features form a cohesive investigation and fix workflow: open debug logs → identify the failing Apex job → run SOQL to check data state → inspect the query plan → make a targeted code edit → execute Anonymous Apex to validate. That entire loop now happens in a single tool, inside Salesforce, without switching context once.
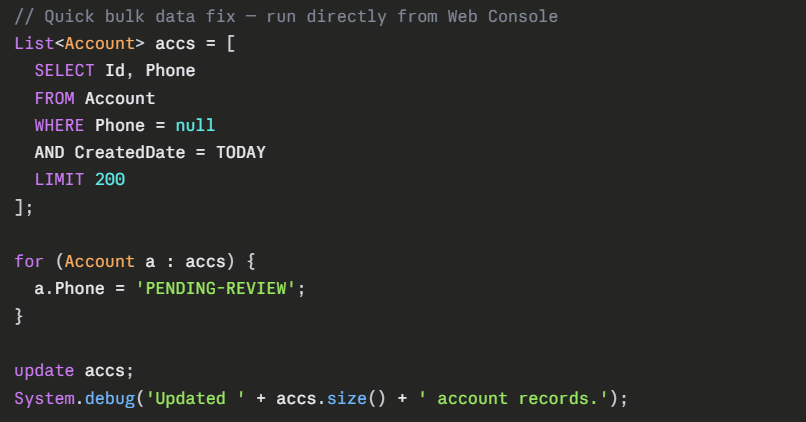
Example: Anonymous Apex executed inside Web Console:
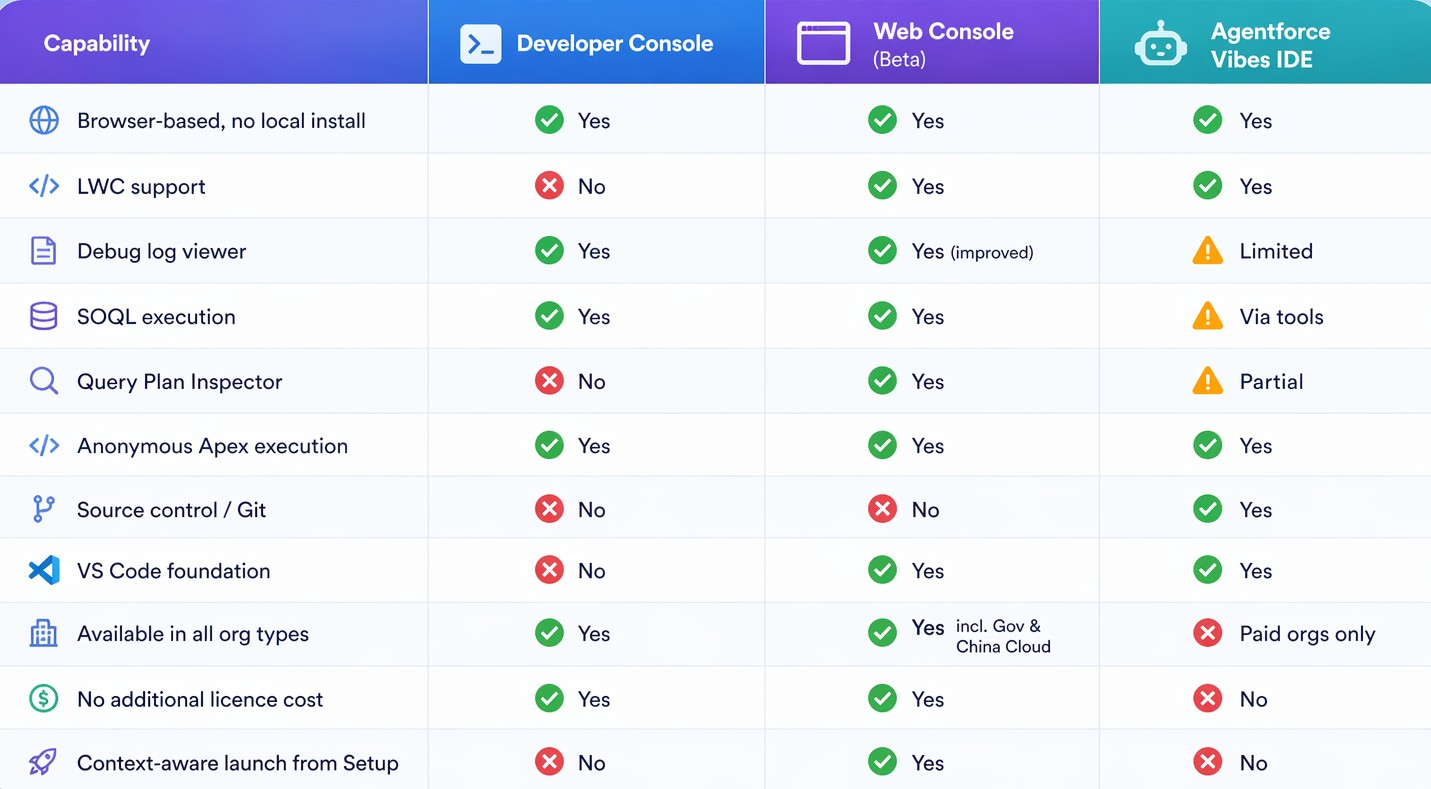
Web Console vs. The Field
There are now three primary browser-based tools in the Salesforce developer ecosystem. Understanding what each is for matters as much as what each can do:
Conclusion
Web Console is a long-overdue addition to the Salesforce developer toolkit. It doesn't try to replace VS Code or Agentforce Vibes IDE – it fills the gap they never could: a fast, modern, zero-setup IDE that lives right inside Salesforce. No more tool-switching. No more unsupported workarounds. Just code, debug, and fix where you already work. The beta is live now. Enable it in your sandbox, explore it today, and be ready when Summer '26 hits production in May - June 2026. For the Salesforce ecosystem, "code where you build" is no longer just a tagline; it's finally a reality.